Hello, Here I will explain how to do simple monitoring using prometheus, node exporter and graphana.
Table of contents
Open Table of contents
Prerequisites
- Docker
- VM lab
Quick Explanation
Using Docker to run container prometheus, grafana and node exporter offer several benefits, particulary in simplifying deployment, management and scaling of monitoring and observability system. The reason we using docker is:
- Easy deployment and setup
- Portability
- Isolation Container
Step by Step
First of all you can clone my repository
git clone https://github.com/kevinavicenna/system-monitoring.git
services:
  node-exporter:
    image: prom/node-exporter:latest
    container_name: node-exporter
    ports:
      - "9100:9100"
    networks:
      - monitoring
    volumes:
      - /proc:/host/proc:ro
      - /sys:/host/sys:ro
      - /:/rootfs:ro
    command:
      - '--path.procfs=/host/proc'
      - '--path.sysfs=/host/sys'
      - '--collector.filesystem.ignored-mount-points="^/(sys|proc|dev|host|etc)($|/)"'

  prometheus:
    image: prom/prometheus:latest
    container_name: prometheus
    ports:
      - "9090:9090"
    networks:
      - monitoring
    volumes:
      - ./prometheus.yml:/etc/prometheus/prometheus.yml

  grafana:
    image: grafana/grafana:latest
    container_name: grafana
    ports:
      - "3000:3000"
    networks:
      - monitoring
    environment:
      - GF_SECURITY_ADMIN_PASSWORD=admin
    volumes:
      - grafana-data:/var/lib/grafana

networks:
  monitoring:

volumes:
  grafana-data:
So here I use node exporter as monitoring cpu, memory, disk i/o, and network, and configured to scrape data from Node Exporter, and then Grafana is a visualization tool that connects to Prometheus as a data source.
if we want to run on all container type docker compose up
docker compose up -d
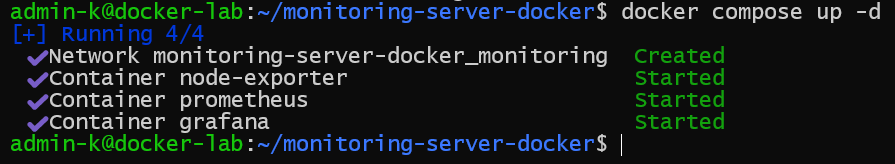 we can see that grafana run on port 3000, then open our browser and type our ip and port to access web interface

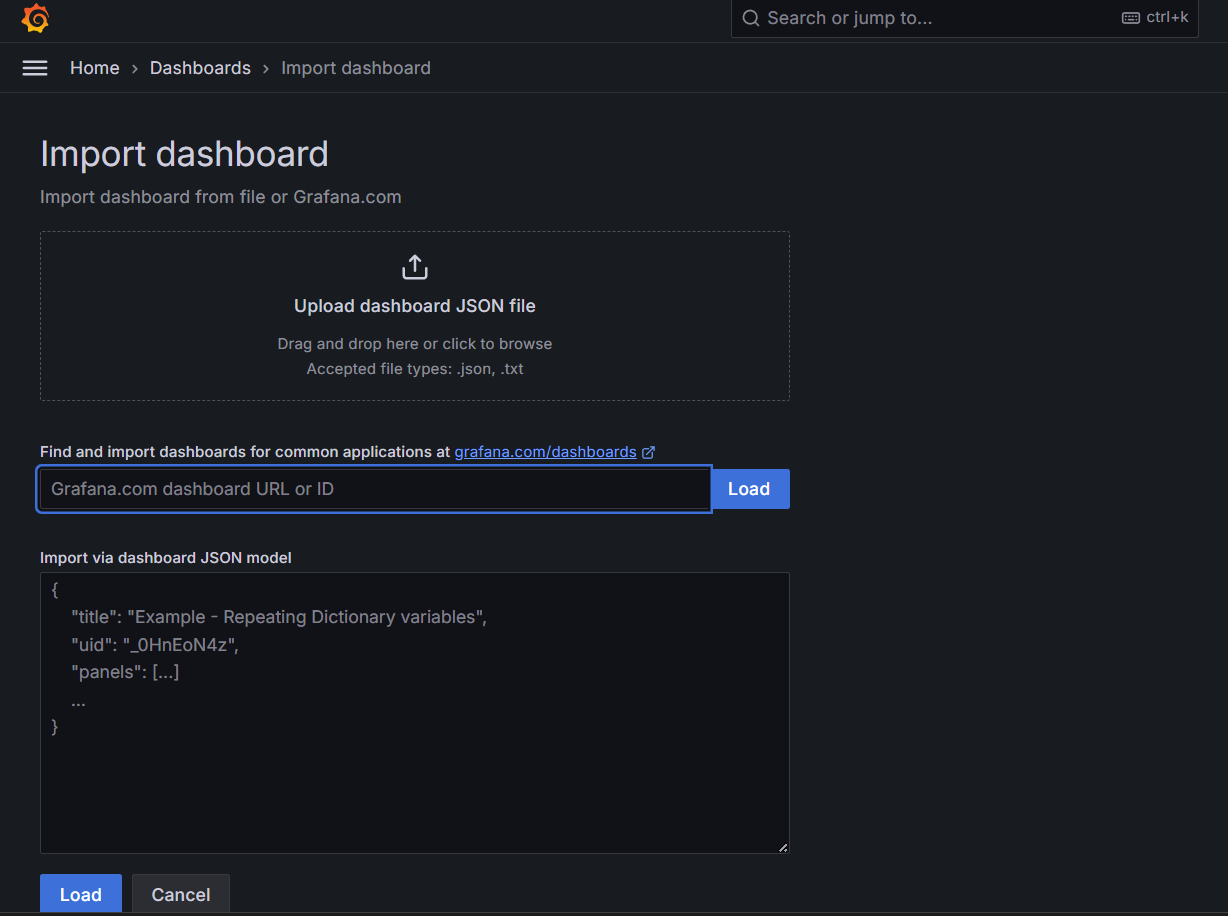
then type “grafana node exporter template” and paste the dasboard id/ url to design like this,
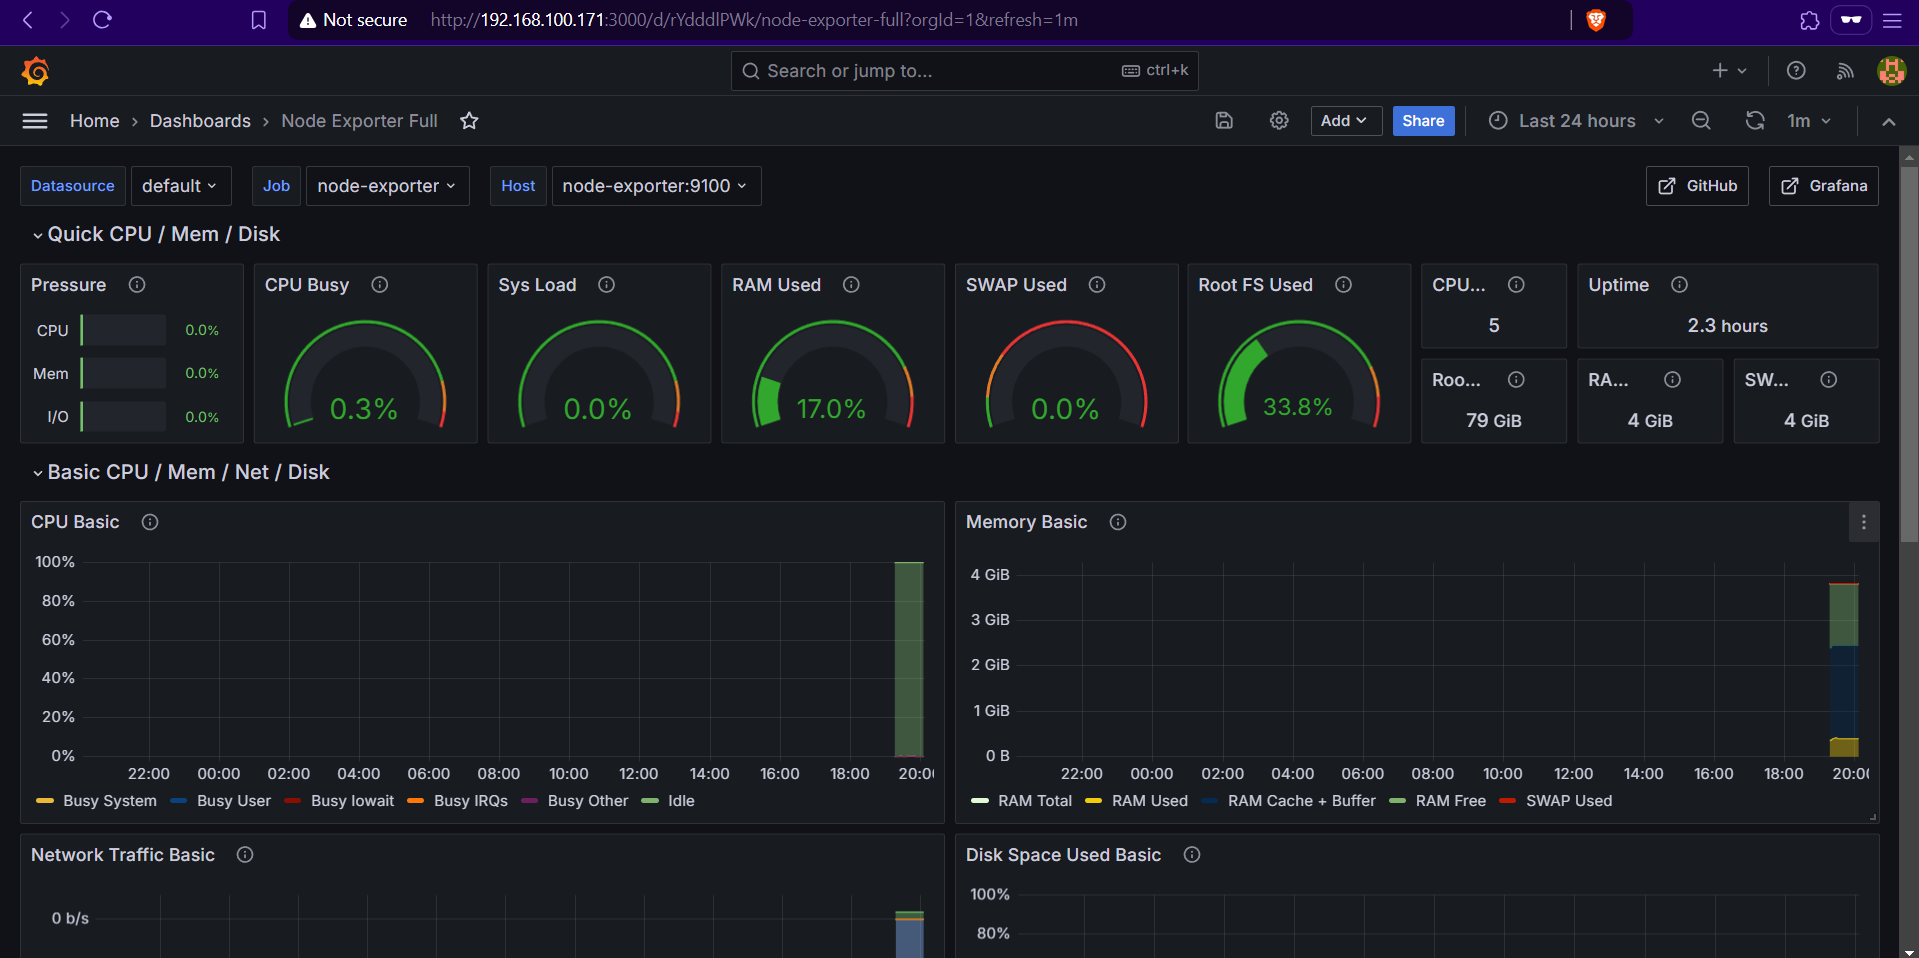
as you can see , the graph shows that there is still little data, because the vm that I created has only been running for a while
Persistent Data Storage
One of Docker advantages is the ability to handle volumes for persistent storage. For Grafana, this means that your dashboards, settings, and data won’t disappear if the container restarts. Here’s how you ensure data persistence:
    volumes:
      - grafana-data:/var/lib/grafana
Troubleshoot
when we face a problem we can open the log to find out more.
docker logs